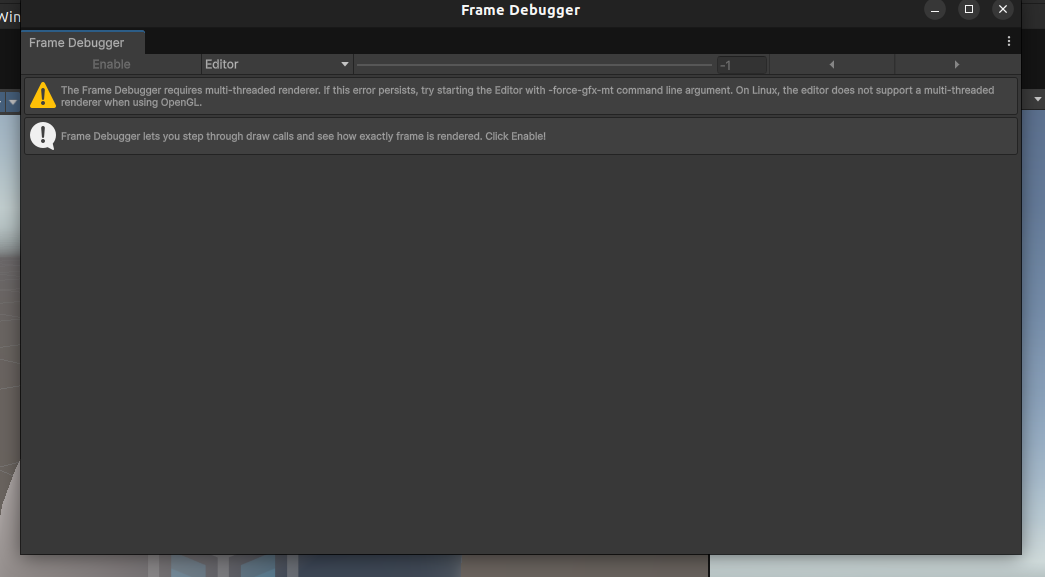
RenderDoc is an [open source] ( https://github.com/baldurk/renderdoc ) graphics debugger currently available for Vulkan, D3D11, D3D12, OpenGL, and OpenGL ES development on Windows, Linux, Android, and Nintendo Switch TM. It is an adequate alternative to the Unity Frame Debugger on Linux, which suffers from a few limitations.
Renderdoc setup on Linux
Installation
- Download the build from here
- Unzip the tarball into
/opt/renderdoc - Add the
grenderdocbinary to PATH
Launch
- Run
grenderdocto open the RenderDoc GUI
Frame capture with RenderDoc
1. Build the Unity app
Build the Unity project as a standalone executable
2. Launch the Unity app from RenderDoc
- Launch the RenderDoc GUI
- Open the Launch Application tab. (todo: clear RenderDoc and take a screenshot of the launch application tab).
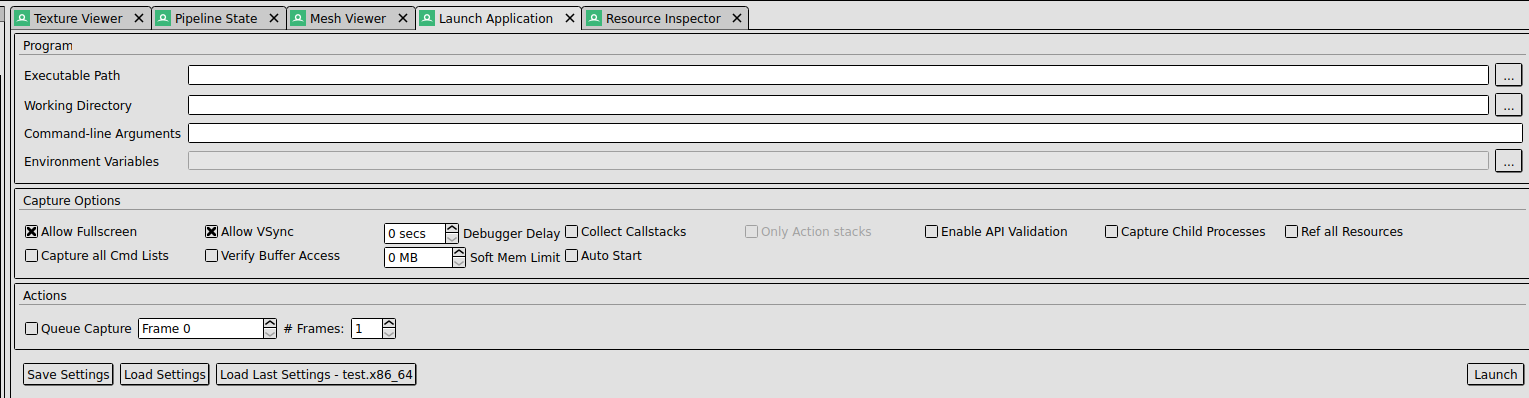
- Fill in the path to the built app’s executable and launch the app. There should be an overlay on the Unity app displaying the frame count.
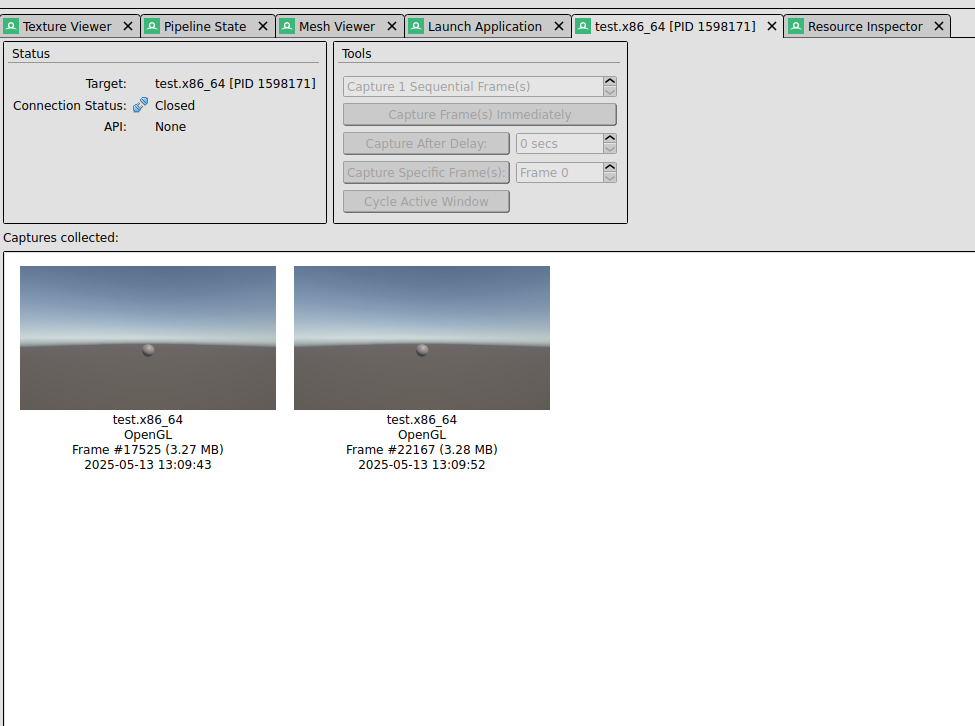
3. Capture a frame
- Click the Capture Frame(s) immediately button then click on the Unity app’s screen. This should create a ‘screenshot’ of the frame under Captures collected.
Additional information about frame capture can be found in the RenderDoc documentation .
Frame analysis with RenderDoc
Event Browser
The event browser displays a list of events that occurred within that frame,
each event identified by an EID (or event id) that indicates which event or API
call referred to when viewing the frame in chronological order. All the
events listed (except for Capture Start) are ‘draw calls’; a count of this
gives the number of draw calls within the frame.
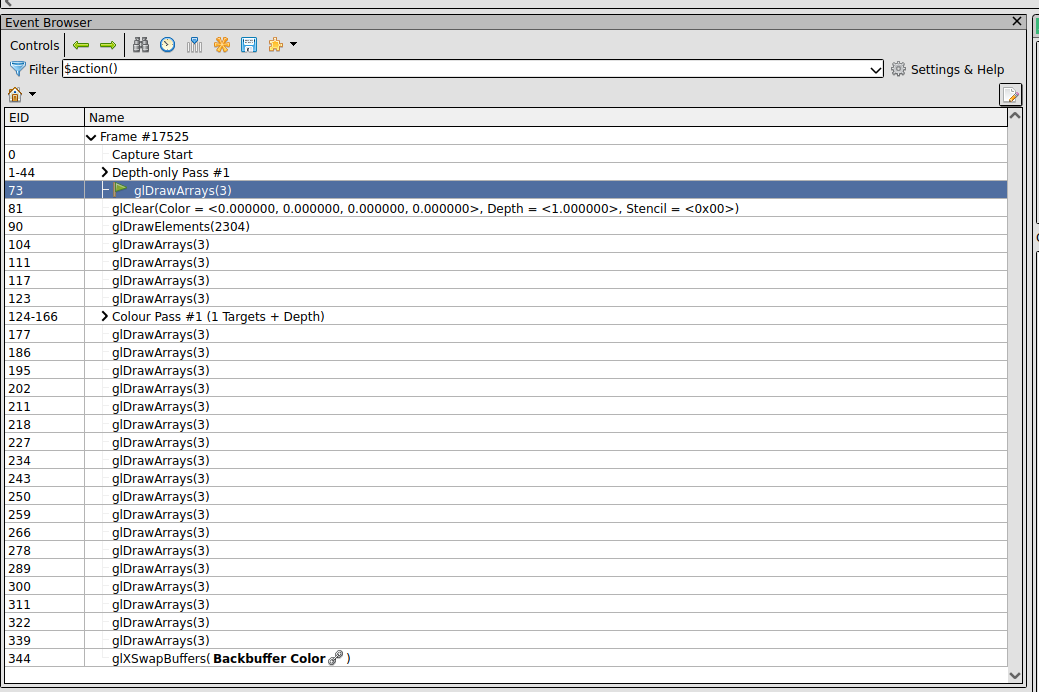
The documentation page expands on the Event Browser panel.
API Inspector
The API Inspector displays the individual API calls between the last event and
the selected event; the last action always corresponds to the selected event.
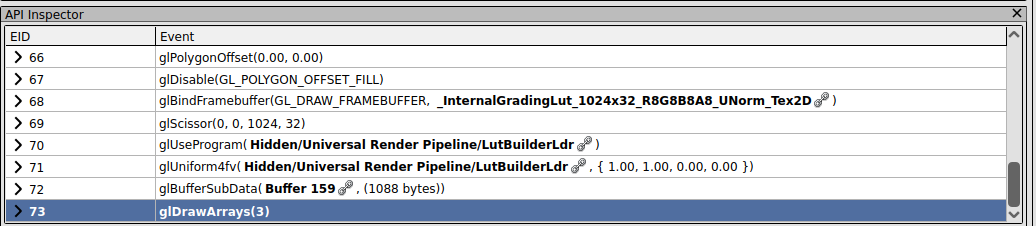
The API Inspector does a whole [lot more](https://renderdoc. org/docs/getting_started/quick_start.html#api-inspector) than outlined in this blog post.
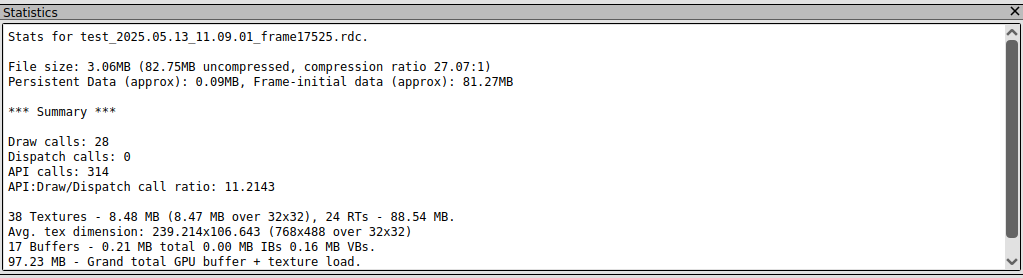
Statistics
- Displays the number of draw and API calls.
- Displays the number and size of the textures.